News Analyzer App Project
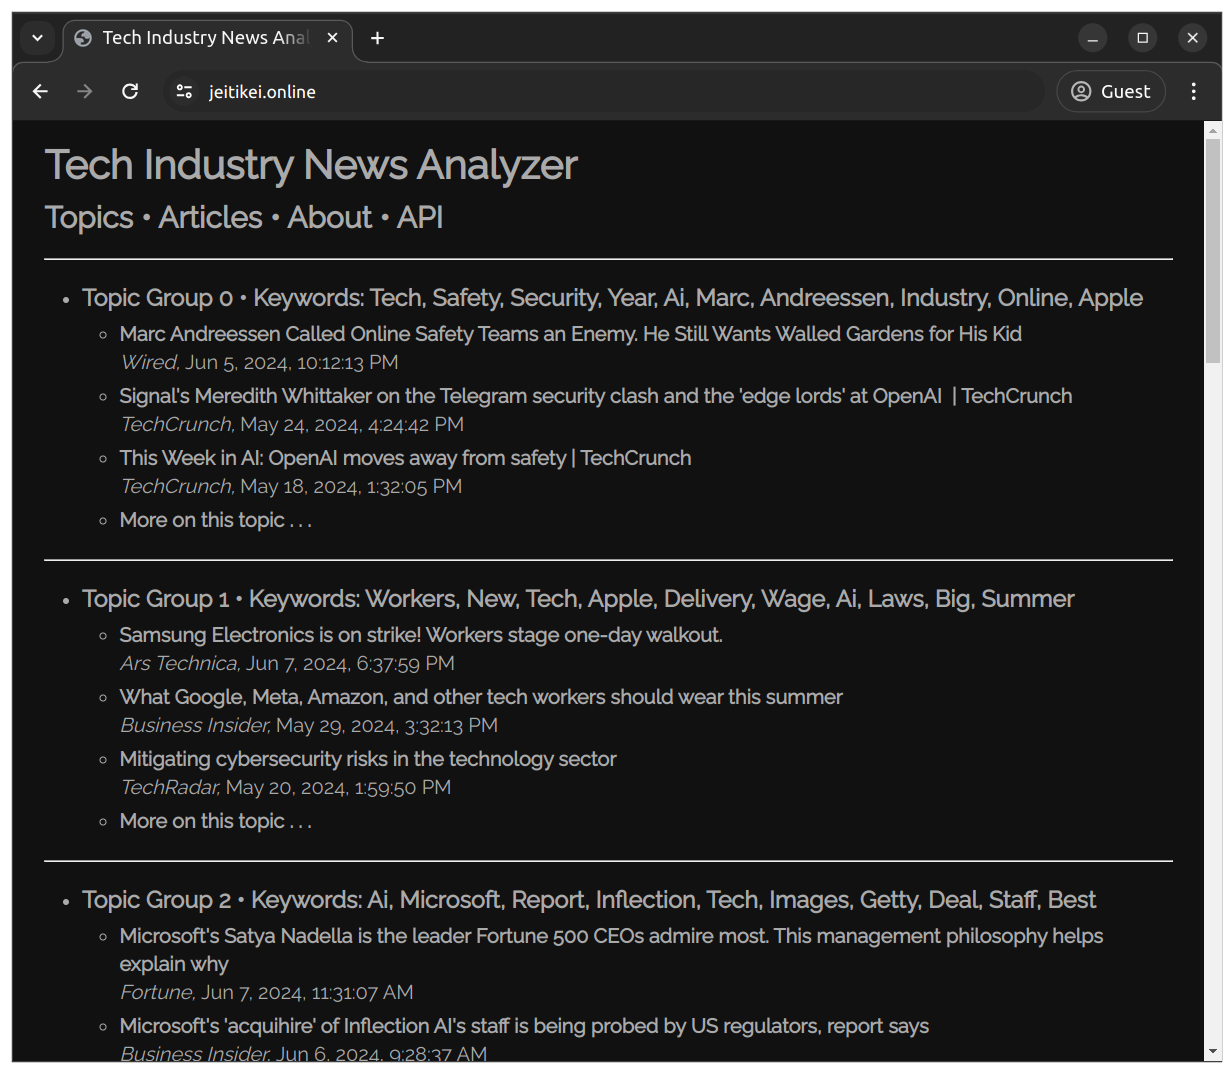
This independent project applied big data software architecture principles and machine learning techniques to analyze recent tech industry news articles, automatically extract common themes, and sort them into groups by topic. The primary aim was to help readers quickly identify current trends in media reporting on the tech industry and focus on the topics of most interest to the reader.
Architecture
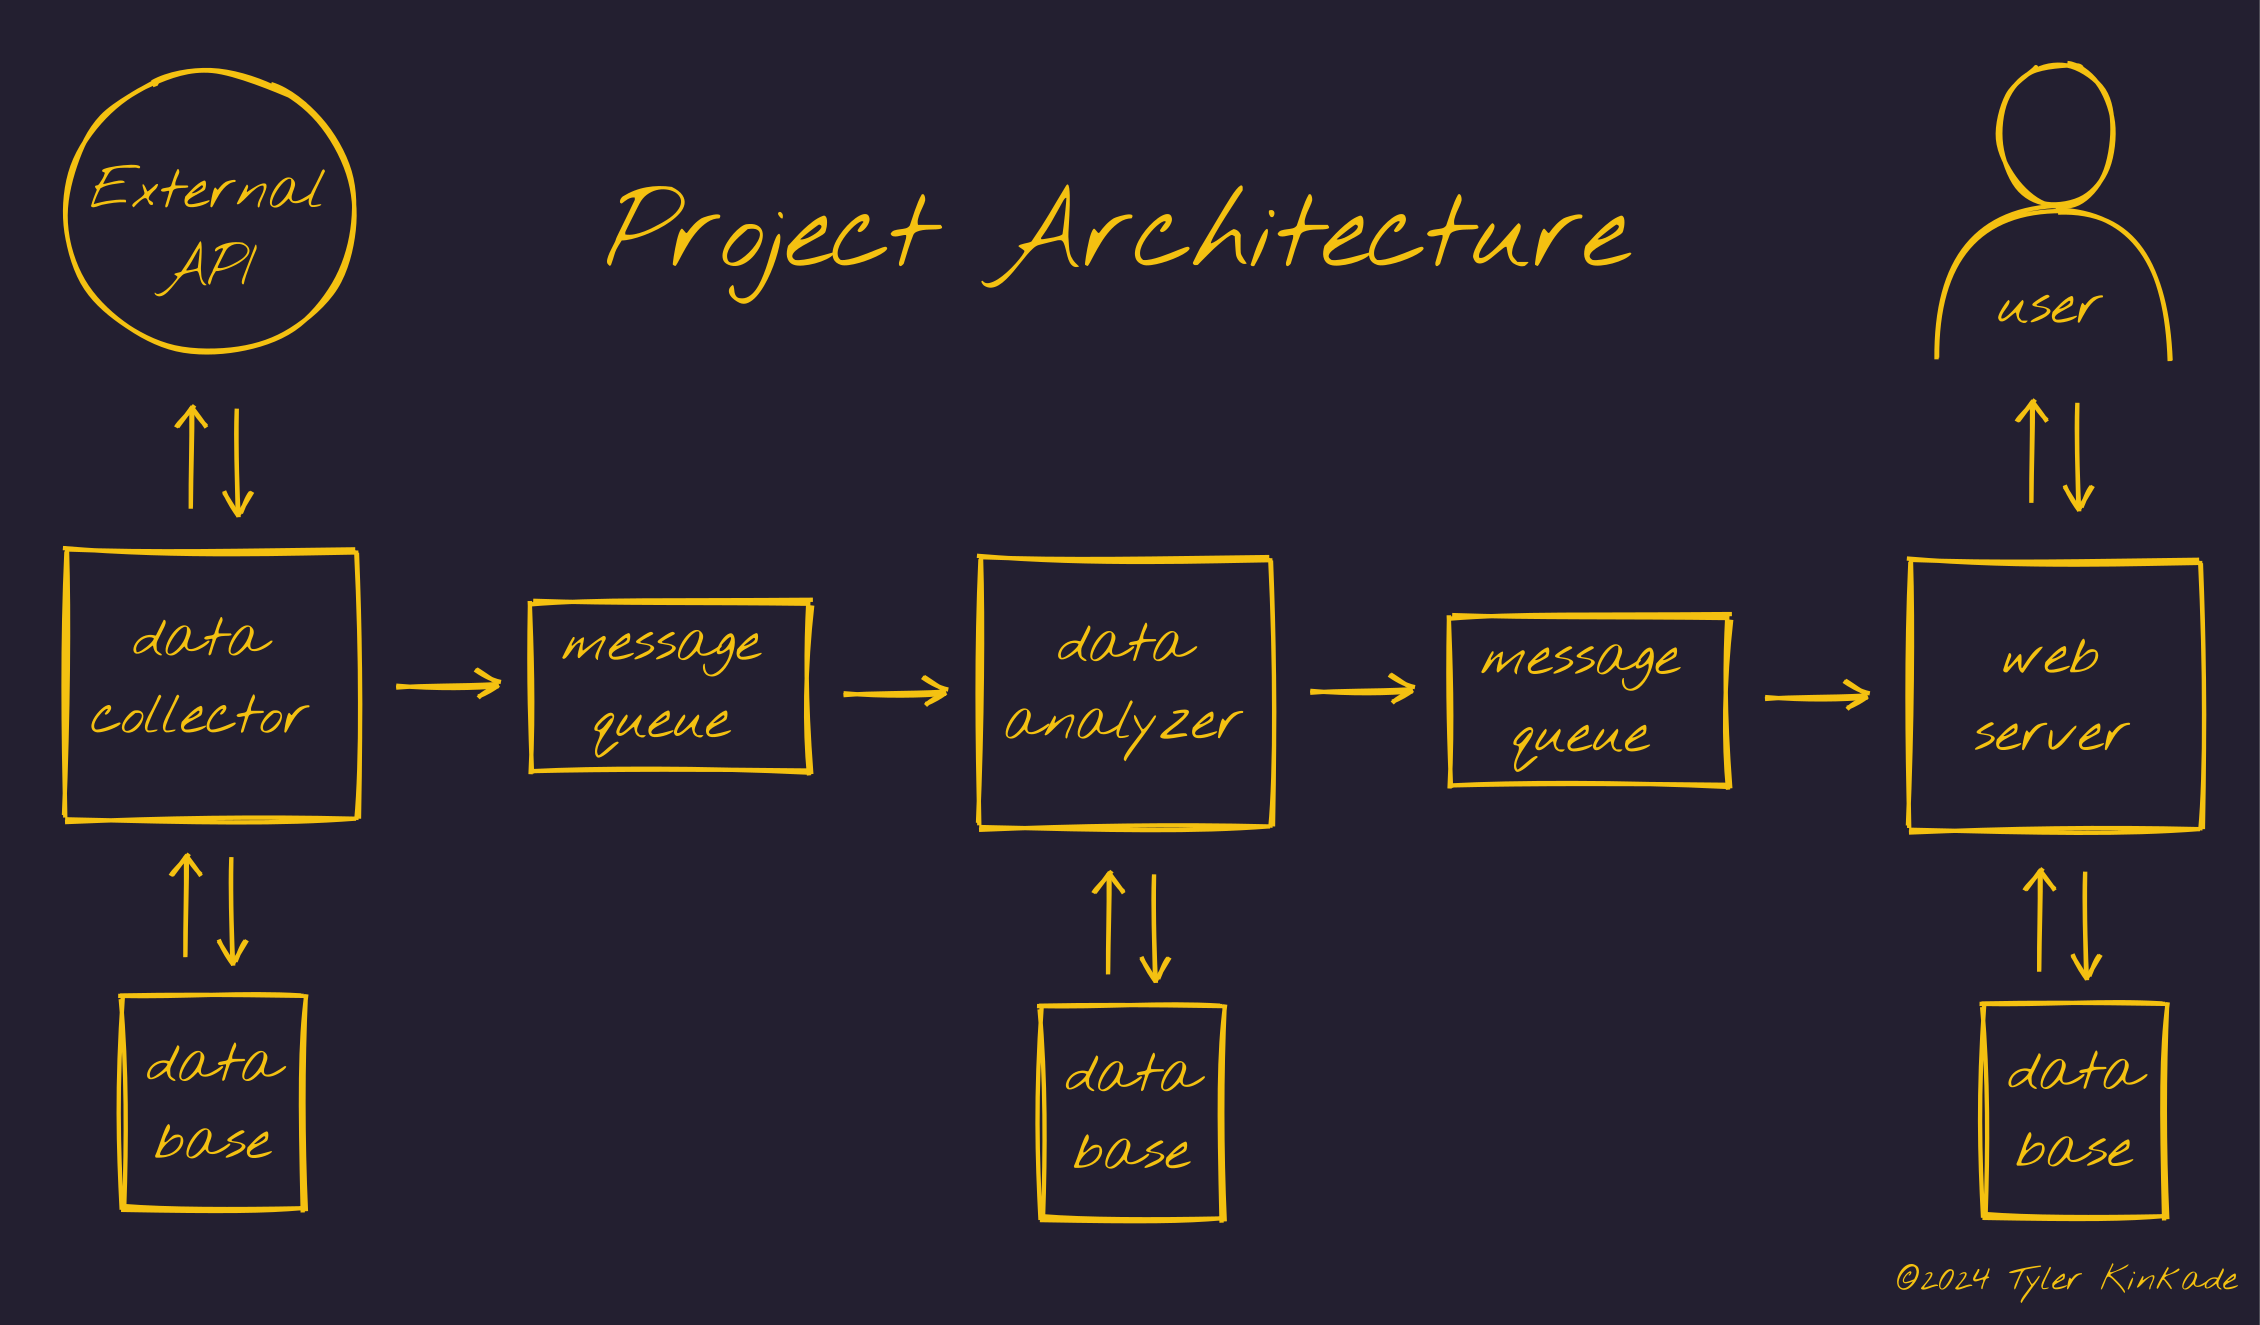
The software architecture consisted of three microservices which interact via a message queue broker, as illustrated in the diagram below. First, (starting on the left side of the diagram) a data collector microservice collects news article data daily from an external internet source (newsapi.org), stores the data in a database, and publishes it to a message queue. Next, upon receiving the data from the message queue, a data analyzer microservice stores it in a database, applies Latent Dirichlet Allocation (LDA) to discover common topics, and publishes the results to another message queue. Finally, a web microservice receives the data, stores it in a database, and presents the articles sorted by topic to the end user via web pages and a REST API service.
Design
The project design was guided by current best practices in software development and big data architecture. Through the use of containerized pods with delivery-confirmed message queues and data persistence, service interruptions to the end user are minimized and the system remains robust to temporary partitions between the services. Because the collected data is well-structured, relational databases are used to efficiently store, process, and retrieve the data. In addition, test doubles and mock external services were used to implement efficient unit and integration tests in an automated continuous integration and deployment workflow. Furthermore, online metrics and visualizations permit real-time monitoring of system performance.
Tech Stack
The following technology tools were used to implement the project:
- Ubuntu (22.4.4): Operating system
- Kotlin (1.9.22): Programming language
- Java Virtual Machine (17.0.10): Compilation and libraries
- Gradle (8.7): Build tool
- Ktor (2.3.8): Kotlin application framework
- Netty (4.1.106): Web server
- Apache Freemarker (2.3.32): Dynamic webpage templating
- PostgreSQL (16.2): Relational database
- Exposed (0.48.0): Object relational mapping framework
- HikariCP (5.1.0): Database connection pooling
- Apache Spark (3.3.2): Data analytics
- Kotlin for Apache Spark (1.2.4): Kotlin-Spark compatibility API
- RabbitMQ (5.21.0): Messaging broker
- Junit (4.13.2): Testing
- Kover (0.7.5): Test code coverage measurement
- Micrometer (1.6.8): Application metrics interface
- Prometheus (2.51.2): Performance metrics and monitoring storage
- Grafana (10.4.2): Performance metrics visualization
- Docker Engine (25.0.3): Containerization
- Kubernetes (1.30.0): Deployment container orchestrator
- Kompose (1.33.0): Docker Compose to Kubernetes conversion tool
- Helm (3.14.4): Kubernetes package manager
- GitHub: Version control, continuous integration and deployment
- Google Kubernetes Engine (1.28.8): Cloud computing service
Testing
Gradle was used to implement unit and integration tests, and these tests were incorporated into the continuous integration/continuous deployment workflow. Using test doubles and mock external services, the unit tests check each element of the system (e.g., database operations, message queue, data processing, etc.), and the integration tests check that these elements function together at the app level as expected: that the data can be reliably (1) collected, (2) stored in the collector database, (3) transferred to the data analyzer, (4) processed with unsupervised machine learning (LDA), (5) stored in the analyzer database, (6) passed to the web server, (7) stored in the web-server database, and (8) displayed to the end user in reverse chronological order grouped by topic.
Production
The project was deployed on Google Kubernetes Engine using Helm.
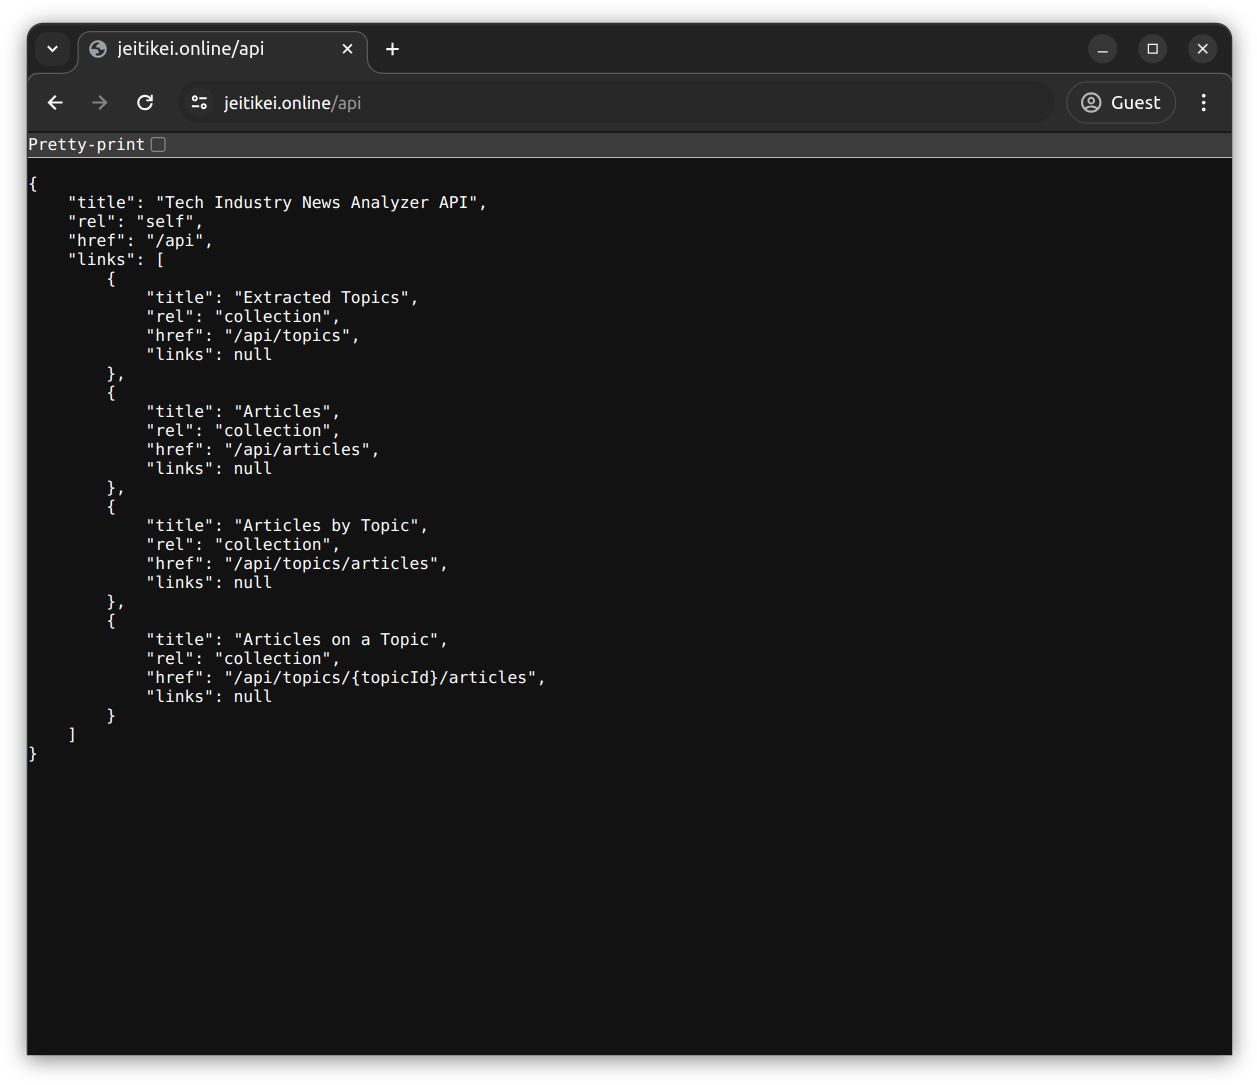
REST API
HATEOAS principles were applied in order to facilitate hypermedia-driven discovery of the endpoints within the API.
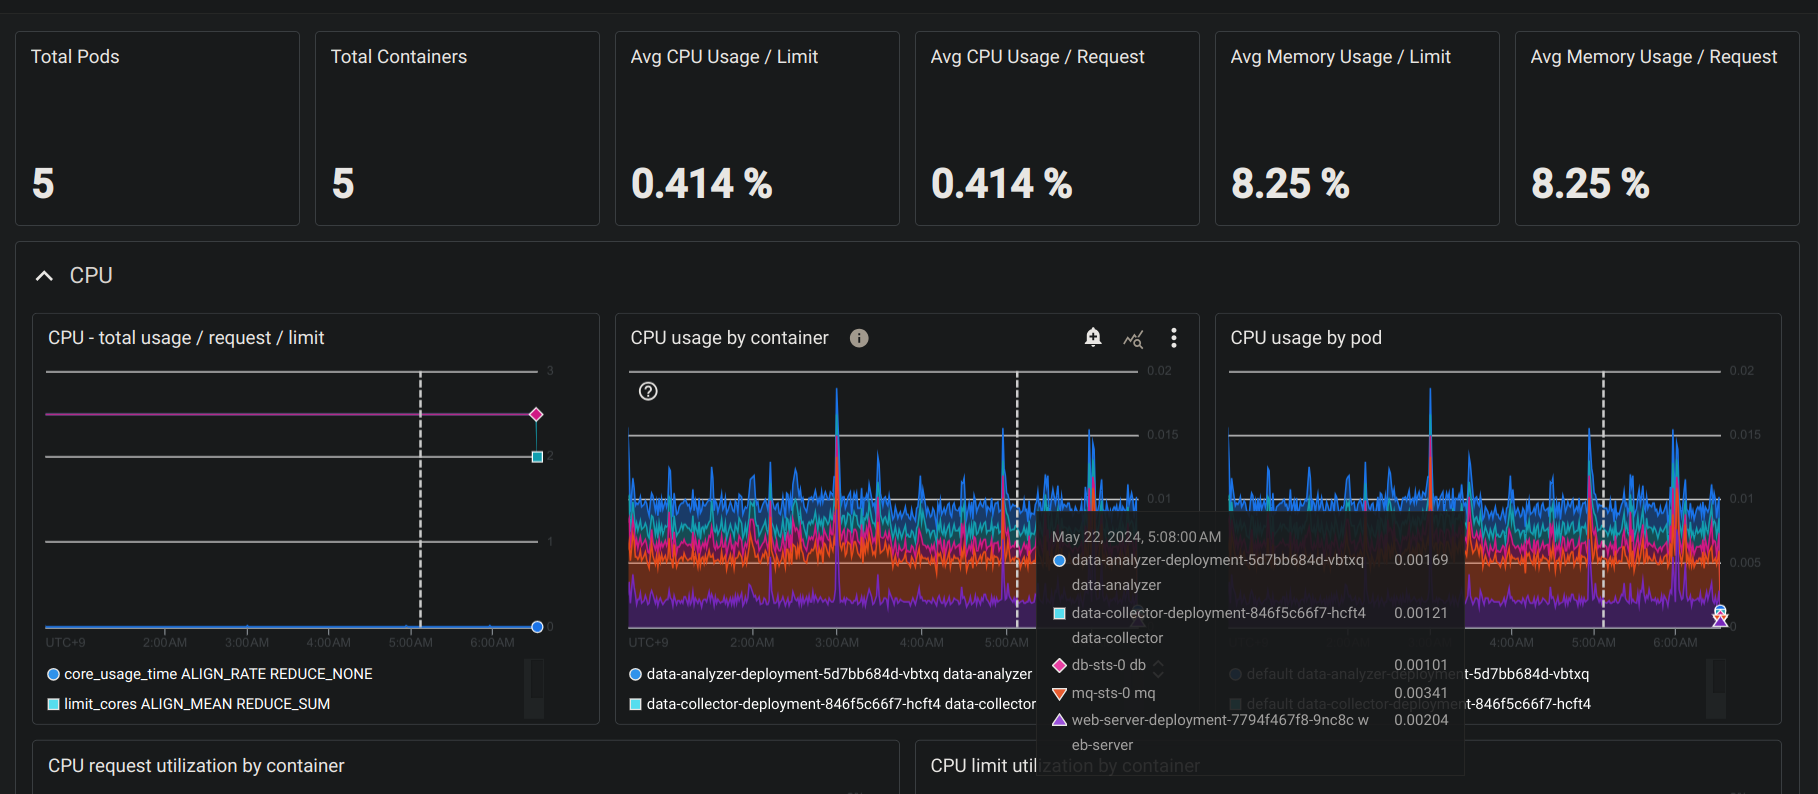
Monitoring
Production monitoring was accomplished by scraping metrics with Prometheus and visualizing with Google Cloud Monitoring.